
[ Table of Contents | Research Center | Advertising | Submit URL | Shopping| E-Mail | Home ]
Compliments of
Great Pacific Trading Company
1235 N.E. Sixth Street
Grants Pass, OR 97526
(800) 479-7920
http://www.gptc.com/gptcweb/site-by-site.htm
U.S. Options & Futures | Seasonal Futures Charts
The seasonal charts depicted in this publication are a pictorial presentation of the normal behavior of the markets. The charts are made for specific contract months, so that the trader can see the behavior of the specific contract they are looking at. This detail is of the utmost importance in markets with new and old crop contracts, such as the agricultural commodities.
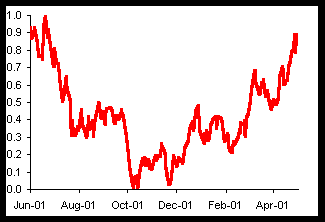
The charts depict behavior on a relative basis, meaning the actual prices are not forecast, just the relative position of the market versus its contract high and low. On the seasonal charts, the high is depicted as 1.0, or 100%, while the low is depicted as 0.0 or 0%. Using an 11 month period, we rank all 15 years analyzed in terms of where each day falls as a percentage of the highest and lowest price of that 11 month period for each specific year. These prices are then averaged and the average is depicted in our charts.
To read the chart, just follow the chart and remember that 1.0 is the contract high for the 11 months displayed, and 0.0 is the contract low.
For example, assume you are following the September 1999 Bean Oil futures. Examining the chart below, you can assess that on average Soybean Oil tends to rally from late November into late December, breaking slightly into the New Year. From its January low, September Bean Oil usually rally with only moderate corrections into late May. By the second week of May, September Bean Oil typically makes its seasonal high, breaking quite violently in June and July, to finally make its seasonal bottom during the third week of August.
Figure 1: September Soybean Oil 15 year Seasonal Chart (1984 - 1998)

Knowing that Soybean Oil tends to make its high in mid to late May, the trader holding long positions should operate with greater caution, while a trader looking to establish short positions may wish wait until this period to establish those positions. The seasonal charts are an extremely useful tool, which allow the futures speculator to plan in advance his/her strategy, using historical turning points to aide other forms of analysis.
For more information on seasonal analysis, visit www.GPTC.com
Disclaimer: The risk of loss in trading futures and options can be substantial, therefore only genuine "risk" capital should be used. Opinions expressed on these pages are based on information believed to be factual, but no guarantee is being made towards accuracy, or completeness. Great Pacific Trading Company and its staff can not be held responsible for conclusions drawn from these pages. No responsibility is assumed or implied by the statements, charts, or graphs contained in this forum. This is not a solicitation to buy or sell, but merely a market bulletin.